Watch a servo or drives person in action, and it is generally only a matter of time before they are looking at a velocity vs time trace to fine tune the performance of a motor system. The reason: events that are occurring much faster than the eye can observe must be scrutinized. In Siemens TIA Portal, we have the ability to generate and save traces of our PLC logic.
The Trace tool and Logic Analyzer within TIA Portal is a powerful ally in observing sequencing of events that are occurring faster than can be observed in a traditional monitor mode. The resolution can be set as low as “per scan”, to help a programmer or maintenance person diagnose the causality of a problem or to observe how the program reacts to a given situation. Once activated, the result of the trace is stored in temporary memory on the CPU.
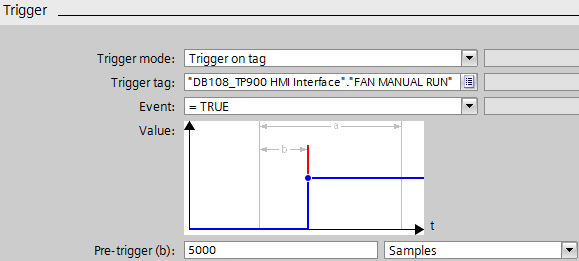
The tool is configured offline from the S7-1200 or S7-1500 CPU, and then downloaded and armed. The triggering can be immediate, or it can be configured to trigger based upon a specific event. Better still, it has a pre-trigger data collection feature that buffers the data continuously and when the trigger event occurs, the returned data can include information from before the trigger event. So not only can you observe what happened after the trigger occurred, but also what was going on for a few thousand scans before the trigger event.

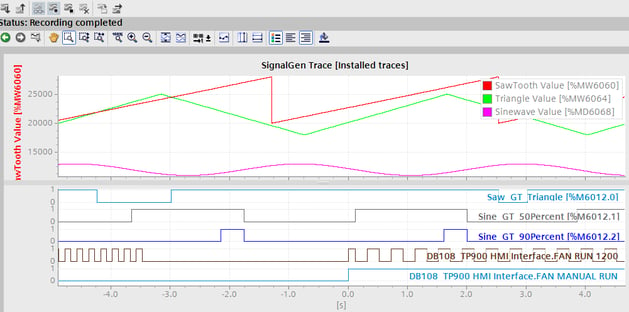
View of a saved Trace (note the pre-trace data before 0.0 seconds)
You may trace up to 16 signals of analog or binary values, with the trade-off being the amount of cycles you can sample. Basically, you have a set number of samples to distribute between the number of signals you are tracing and the duration of the trace. Enabling a trace will have a small impact on your scan time, so keep that in mind. (In my tests on an S7-1200, I saw ~2ms increase with 8 signals and 5000 scan pre-trace logging).

The trace can be configured, loaded, and armed from TIA Portal. Then the programmer can disconnect. From that point, the trace remains armed until the trigger activates it, regardless of power-downs or most code changes. Once a trace has completed in the CPU, it is stored there until a power-down. It can later be uploaded and stored in the project for comparison with previous saved traces. Or, it can be exported for use outside of TIA Portal. Though a power-down will erase the stored trace, the trace itself will be re-armed when the CPU powers back up.

View of an armed trace, awaiting trigger condition
The Trace tool can be a great help where an event happens at odd hours (that 3am call), or unpredictably (it happens all the time, except when you are monitoring it), or when sequencing of I/O is starting to be questioned (which of those inputs went true first).
* For more detail, review “Using the Trace and Logic Analyzer Function, Function Manual, A5E31277292-AB."
If you're interested in using the Siemens TIA Portal to evaluate your PLC, one of our experts can guide you in getting the most out of this software to boost your business.


